
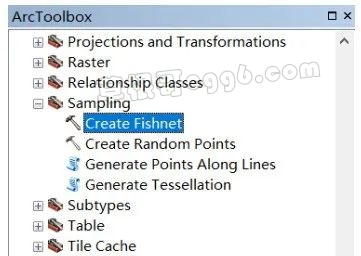
1.Create Fishnet
先准备好需要格网化的polygon矢量
打开Toolbox中的 Data Management Tools,选择 Create Fishnet
Create Fishnet creates a feature class containing a net of rectangular cells.创造一个包含一些列矩形Polygon的shp
使用该工具要求以下三个基本信息:
the spatial extent of the fishnet, the number of rows and columns, and the angle of rotation. 空间范围 行列数 旋转角度
The tool has 11 parameters, and you should think of these in four distinct groups:
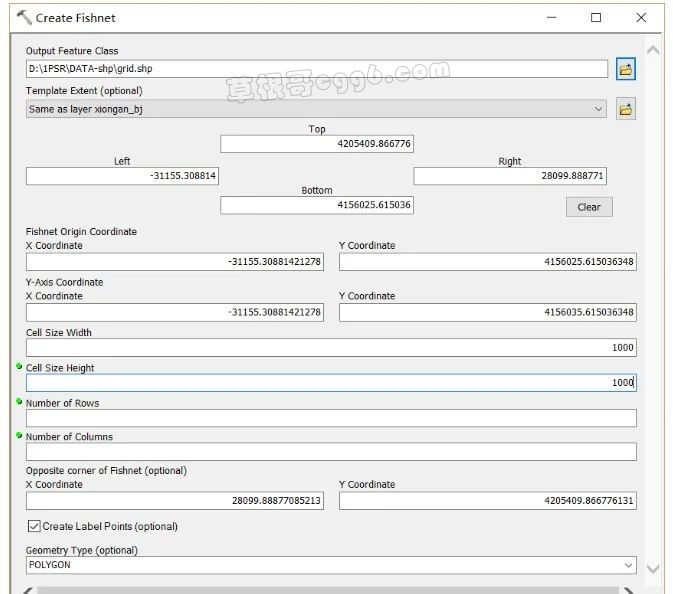
The spatial extent of fishnet
The number of rows and columns and height and width of each cell in the fishnet 输入好行列数/输入cell高度和宽度
The angle of rotation for the fishnet
Parameters that define the output feature class name and type (polygons or lines) and an optional point dataset containing centroids of each cell
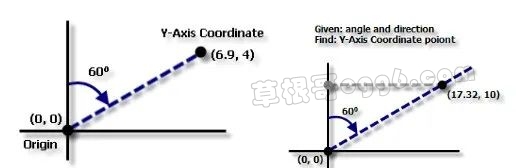
根据需要旋转的角度,以及右上角顶点的y轴坐标,即可使用tan函数计算出右上角顶点坐标,作为 Opposite corner of Fishnet 处的坐标值
Output feature class 输出
可以选择输出为POLYGON 或者 POLYLINE
如果要使用Overlay工具集中的工具在网格上叠加分析,建议选择 POLYGON 作为输出类型
如果只是为了显示网格,选择输出几何类型为 POLYLINE 即可(输出为 POLYGON 比 POLYLINE 要慢很多)
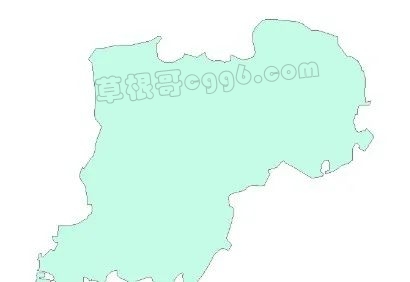
得到1km×1km网格的矢量:
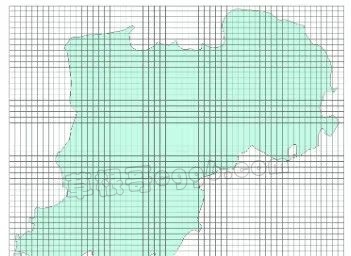
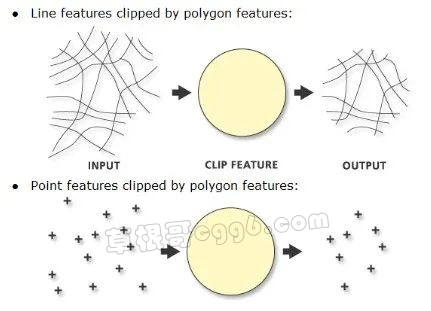
可以使用Clip工具对网格矢量进行裁剪:


得到如下矢量:

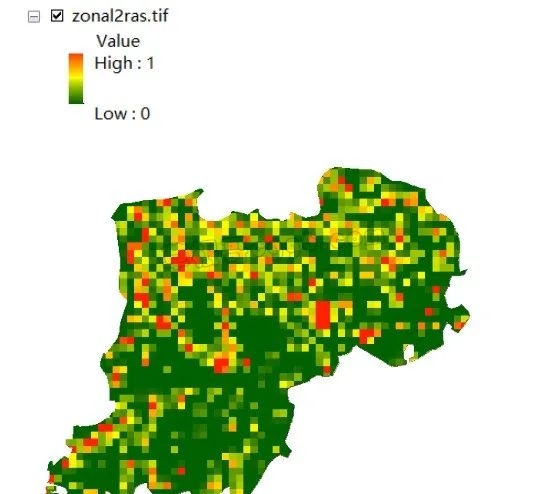
2.分区统计
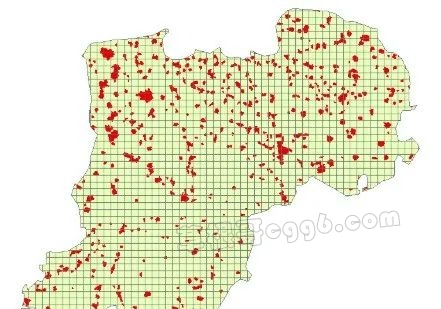
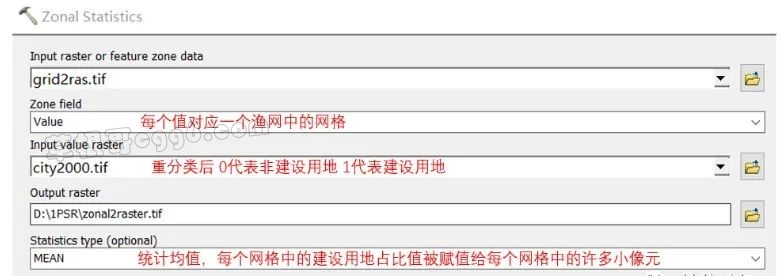
想要计算每个网格中的不同土地利用类型的像元数量(或者是计算某种土地利用类型在网格中所占的比例)可以使用分区统计工具集
例如,想计算每个网格中建设用地(红色区域)所占的面积比例,以表征城市发展强度
这一步可以先把建设用地重分类为1,其他类型重分类为0
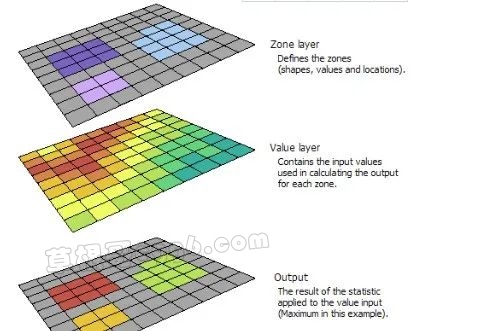
With the Zonal Statistics tool, a statistic is calculated for each zone defined by a zone dataset, based on values from another dataset (a value raster). A single output value is computed for every zone in the input zone dataset.
A zone is all the cells in a raster that have the same value, whether or not they are contiguous. The input zone layer defines the shape, values, and locations of the zones. An integer field in the zone input is specified to define the zones. A string field can also be used. Both raster and feature datasets can be used as the zone dataset.
The input value raster contains the input values used in calculating the output statistic for each zone.
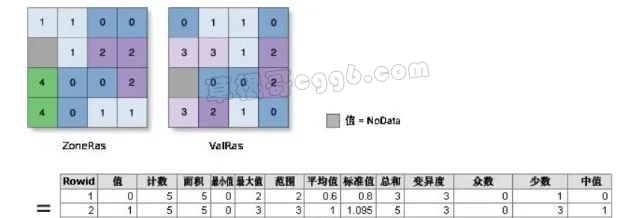
In the following illustration, the Zone layer demonstrates an input raster that defines the zones. The Value layer contains the input for which a statistic is to be calculated per zone.
In this example, the maximum of the value input is to be identified for each zone.
因此,将得到的网格矢量新建一个ID字段以标识每个网格多边形,再输入想要计算的栅格数据在每个网格中的像元的最大、最小、平均值等等。
Output data type
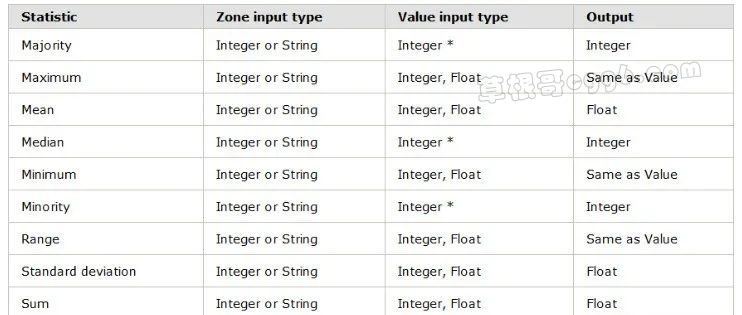
- Only integer is supported
操作步骤:
如果区域输入是矢量要素数据集,应先对其进行“矢量至栅格”转换。并且要确保转换结果与值栅格图像完全对齐,建议您检查环境设置和栅格设置中的范围和捕捉栅格是否设置正确。
如果是栅格数据,则应该保证区域输入和值栅格的像元大小一致,且影像范围一致。

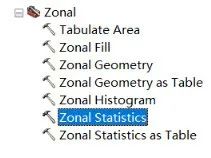
进行分区统计
位于空间分析工具箱中:
得到的结果:
替代方法:
先将栅格数据转为点矢量,这里发现像元的个数和矢量点的个数是相同的。
右击生成的网格矢量grid.shp,选择Join
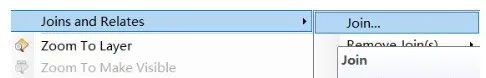
选择基于空间位置连接数据
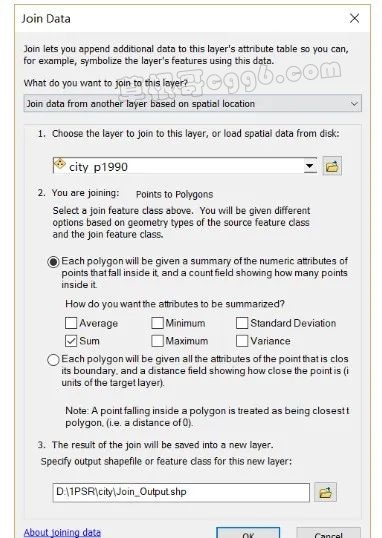
生成的矢量的属性表:Count_代表每个网格中的像元点的个数,Sum_Grid_C代表每个网格中所有的像元点的值的总和(这里等于建设用地像元点的总数量)

通过字段计算器将 Sum_Grid_C / Count_ 即可得到每个网格中的建设用地所占比例。
其实因为只要计算建设用地的面积比例,而建设用地的值是1,因此,直接选择计算落在每个网格中的所有矢量点的值的均值,得到的结果就是建设用地面积比例。

结果如下:
